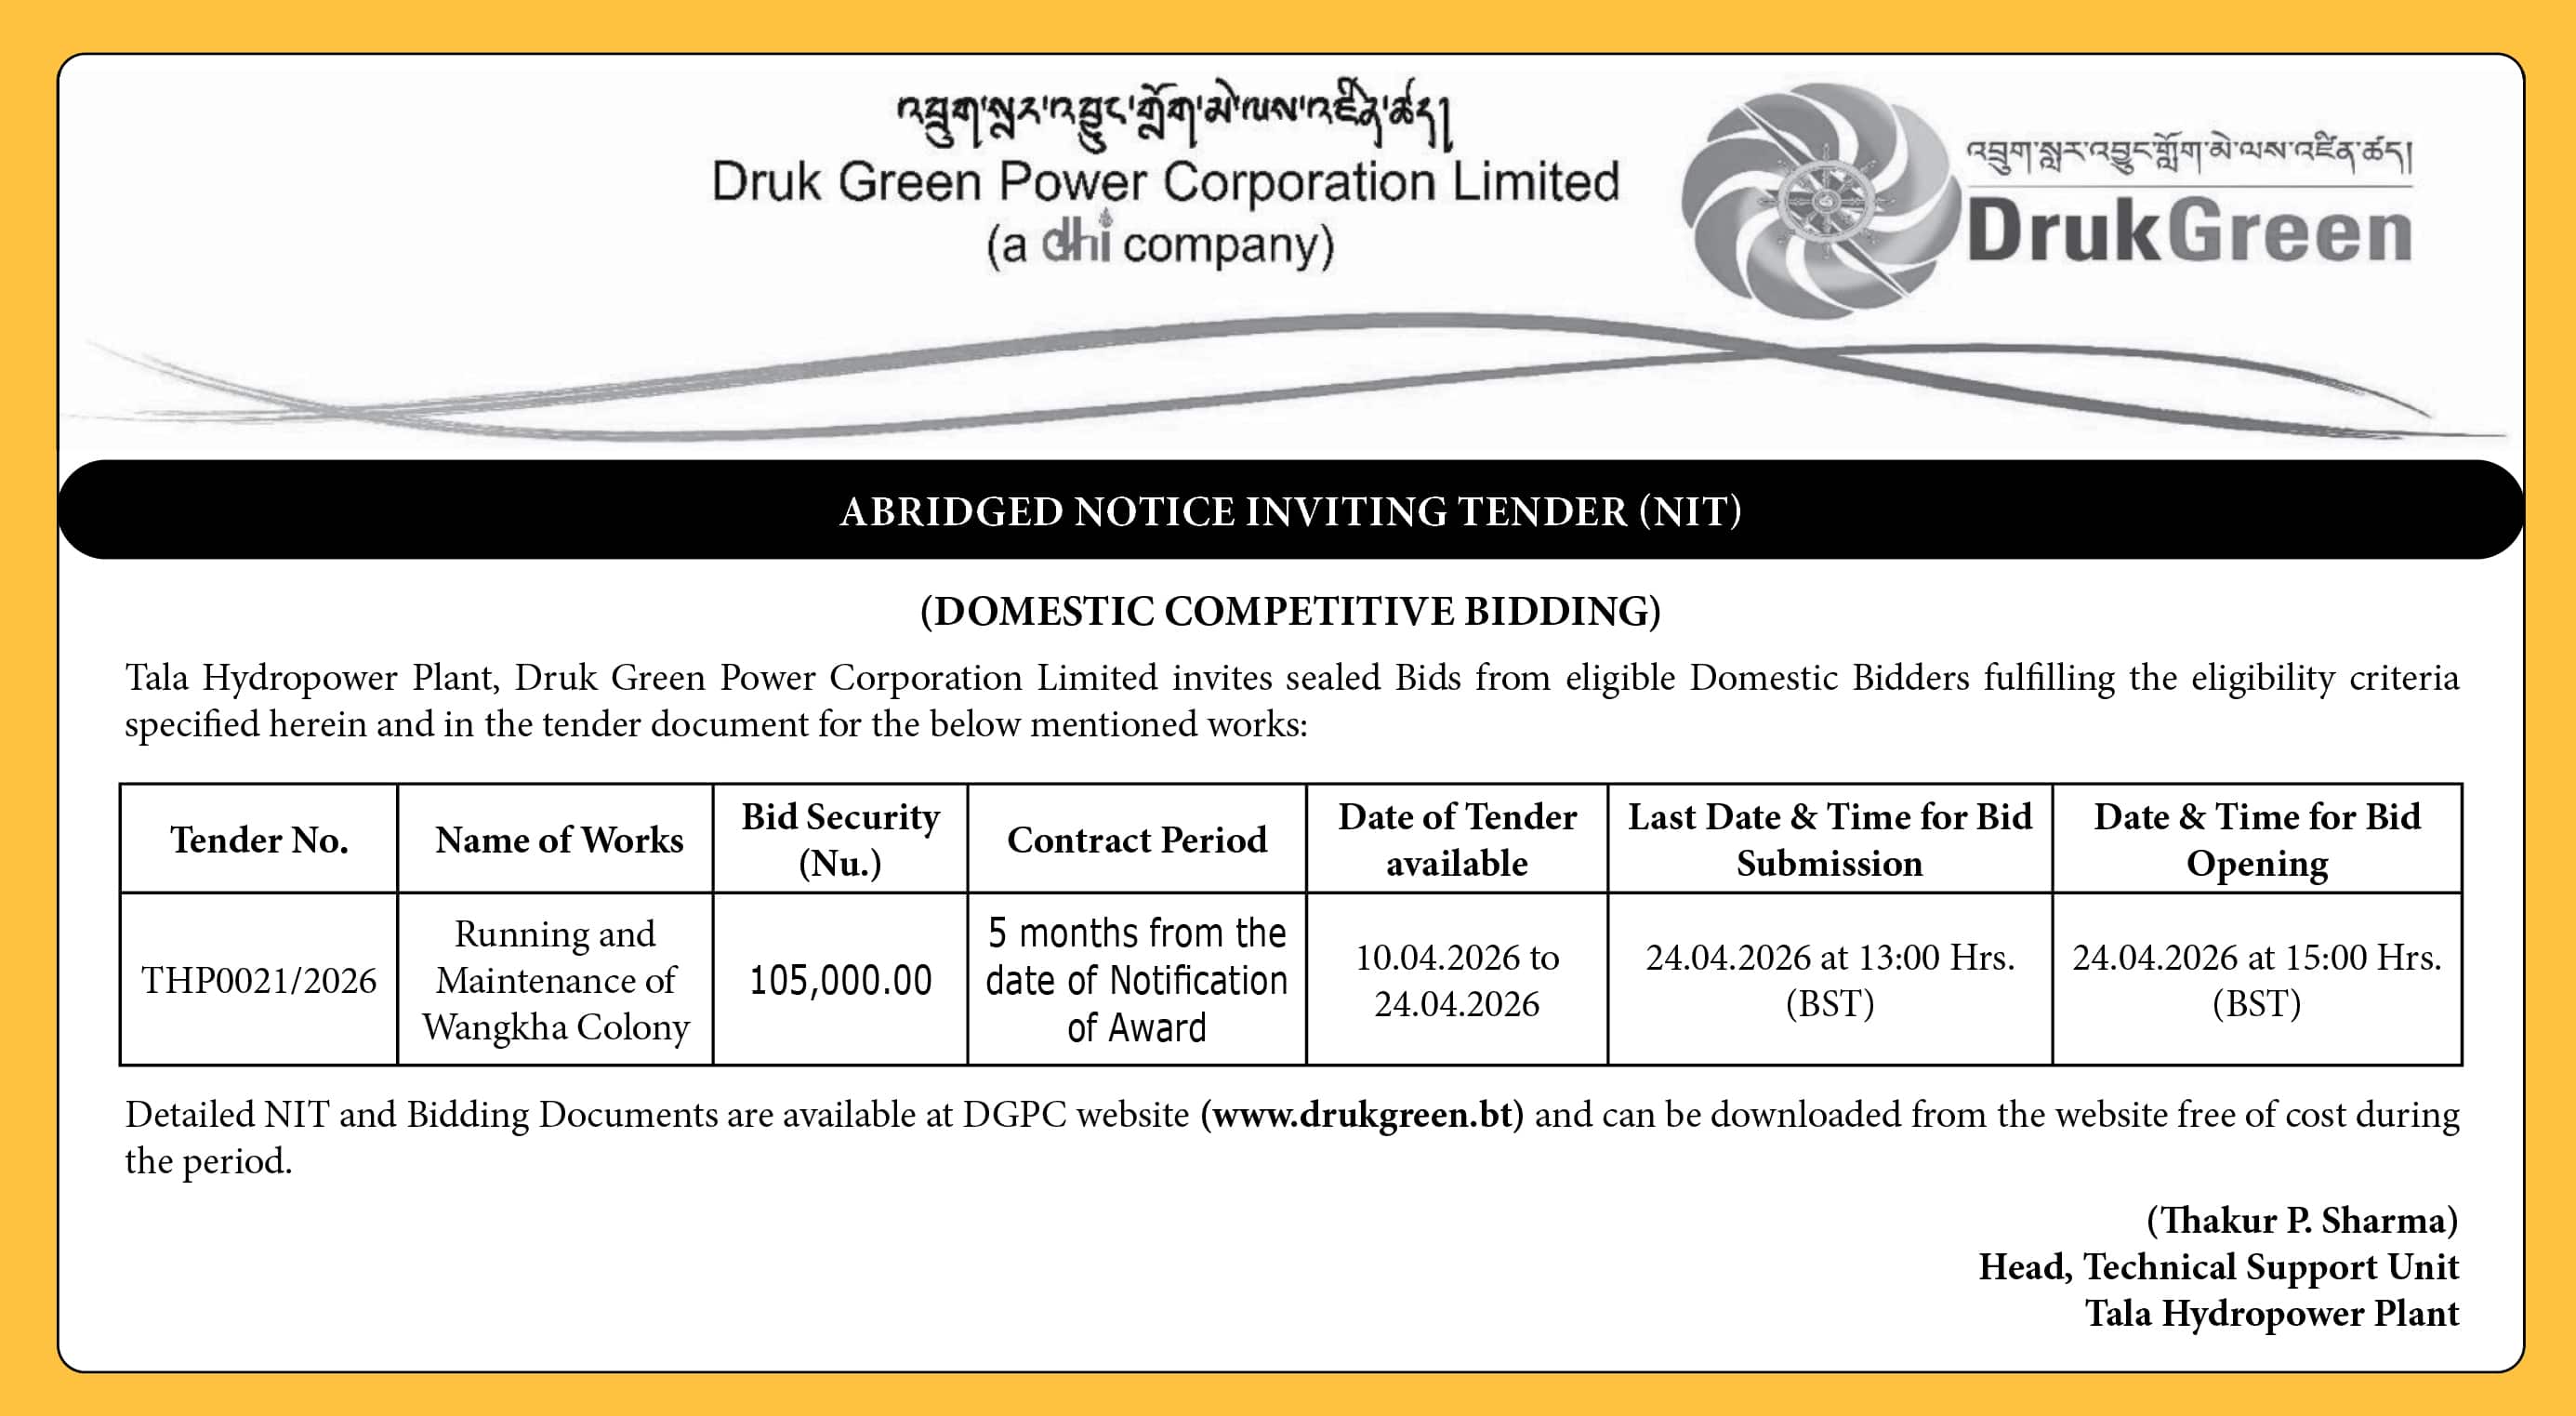
The labour market showed signs of stability in the first quarter (Q1) of 2026, with the overall unemployment rate remaining low at 3.4%. However, underlying data reflected in the Q1 2026 Labour Force Bulletin of the National Statistics Bureau (NSB) reveal a persistent challenge: youth unemployment continues to remain significantly higher than the national average, raising concerns about job access for young people entering the workforce.
The youth unemployment rate—covering individuals aged 15 to 24—stood at 16.5% in the first quarter of 2026, nearly five times higher than the national average. Although this represents a decline of 4.1 percentage points compared to the previous quarter, it is still 0.6 percentage points higher than the same period last year. Youth accounted for 38.7% of all unemployed persons actively seeking work during the quarter.
Labour officials say the elevated rate reflects structural challenges faced by young people transitioning from education into employment.
Records show that the highest number of unemployed individuals is found in the 20–24 age group, after which both the unemployment rate and absolute numbers begin to fall. This trend aligns with typical labour market patterns, where entry-level barriers and limited experience constrain opportunities for younger workers.
Further insights into the causes of unemployment reveal that recent graduates make up a significant portion of jobseekers. About 26.6% of unemployed individuals cited recently completing their studies as the main reason for being out of work. Other key factors include lack of adequate qualifications (16.7%), lack of experience (14.6%), voluntary resignation (9.5%), and mismatch between qualifications and job requirements (7.4%).These findings suggest that the challenge is not just about job availability, but also about skills alignment and employability.
The duration of unemployment also highlights emerging concerns according to the data. While 51.2% of unemployed individuals had been without work for less than six months, nearly half—48.8%—had been unemployed for six months or longer. Notably, 23.6% of all unemployed persons fall into the category of long-term unemployment, having been jobless for more than a year.
At the broader level, Bhutan’s working-age population—defined as individuals aged 15 and above—stood at 615,543 during the quarter, representing 77.8% of the total population. Of this, 52% were male and 48% female, with a majority (62%) residing in rural areas.
Meanwhile, the unemployment rate in Q1 2026 declined slightly from 3.8% recorded in the last quarter of 2025. While this indicates a marginal improvement, officials note that the change is not statistically significant due to overlapping confidence intervals. On a year-on-year basis, the rate is just 0.2 percentage points lower, suggesting that overall labour market conditions have remained broadly unchanged.
Disaggregated by gender, unemployment stands at 3.0% for males and 3.9% for females, highlighting a modest but persistent gap. While the overall figures suggest near full employment, the situation for young jobseekers presents a stark contrast.
The total economically active population reached 402,396 individuals, with males accounting for 59% while the rest were females. Labour force participation remains higher in rural areas, where 63% of the active population resides, compared to 37% in urban areas.
The Labour Force Participation Rate (LFPR) rose to 65.4% in Q1 2026, continuing a gradual upward trend observed over recent years. This marks an increase from 64.6% in the previous quarter and 64.3% in the same quarter last year. Since Q1 2024, the LFPR has increased by 1.5 percentage points, indicating a steady expansion of economic activity.
Gender disparities, however, remain evident. Male participation stands significantly higher at 73.9%, compared to 56.0% for females. Despite this gap, female participation has shown gradual improvement over time. Similarly, rural areas continue to record higher participation rates (66.6%) compared to urban areas (63.4%).
The proportion of individuals outside the labour force declined to 34.6% in Q1 2026, down from 35.7% a year earlier. However, inactivity remains higher among females at 44.0%—18 percentage points higher than the male rate of 26.1%.
The reasons for labour force inactivity also differ by gender. While most males outside the labour force cited education and training as their primary reason, females predominantly reported household and family responsibilities. Around 17% of inactive individuals indicated retirement or pension as the reason for not participating in the labour market.
On the employment side, the overall employment rate improved slightly to 96.6%, up from 96.2% in the previous quarter. Male employment stands at 97.0%, while female employment is slightly lower at 96.1%.
Rural areas continue to outperform urban areas in employment rates, with 97.8% compared to 94.6% in urban centres. This disparity is largely attributed to the high proportion of rural residents engaged in self-employment, particularly in agriculture.
Of the 388,787 employed individuals, 40.1% are engaged in the agriculture sector, 45.9% in services, and 14.0% in industry. The data also reveal gender-based differences in sectoral employment: males are more concentrated in the services sector, while females are more heavily represented in agriculture.
Employment type distribution shows that 40.7% of workers are paid employees, while 33.8% are own-account workers. Contributing family workers make up 25.5% of total employment, underscoring the importance of informal and household-based economic activities.
The data showed that income disparities remain a concern with the average monthly income for employed individuals standing at Nu 26,196. However, male workers earn an average of Nu 28,752—Nu 7,114 more than their female counterparts. This wage gap persists across both urban and rural areas.
The median monthly income is reported at Nu 20,000, indicating that half of the employed population earns below this level, pointing to income inequality within the workforce.
Tashi Namgyal, Thimphu