

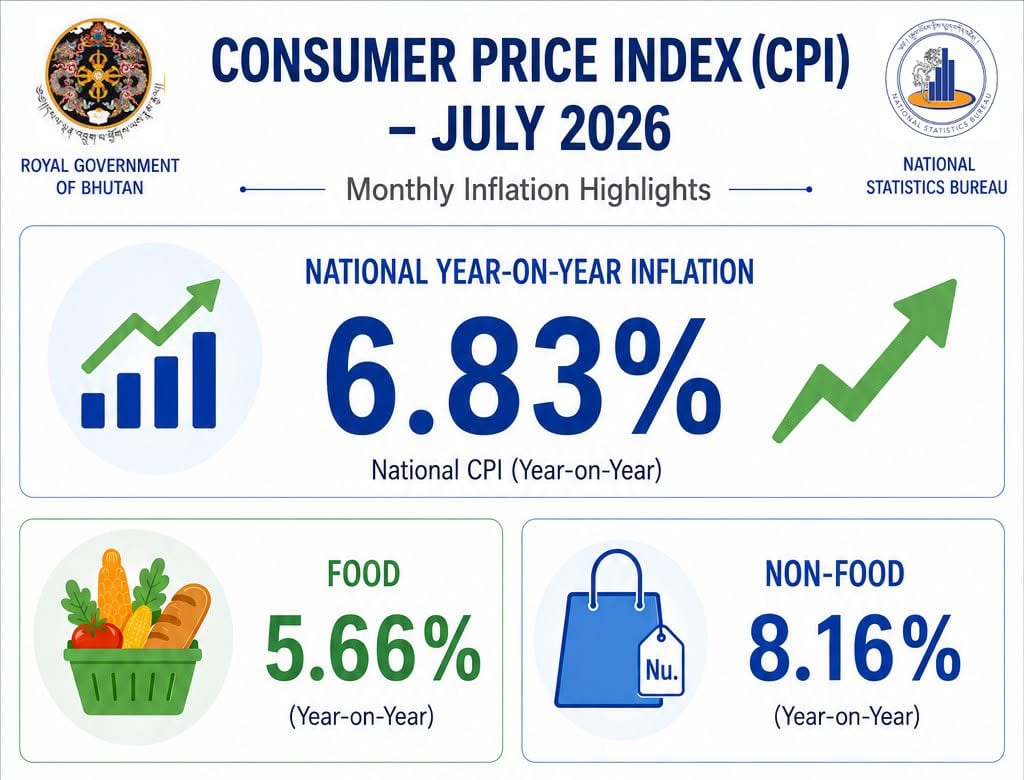
Annual inflation rate in the country climbed to 6.83 percent in July 2026, driven by continued increases in both food and non-food prices, according to the latest Consumer Price Index (CPI). The July inflation figure represents the percentage increase in the overall price level compared with July 2025. Food prices rose by 5.66 percent year-on-year, while non-food prices increased more sharply by 8.16 percent, putting additional pressure on household purchasing power.
On a month-on-month basis, however, the movement in prices was relatively modest. The national CPI increased by 0.24 percent in July compared with June. The monthly increase was largely driven by food prices, which rose by 1.16 percent, while non-food prices declined by 0.69 percent during the same period.
The contrasting monthly and annual movements suggest that while some non-food prices eased during July, their overall price levels remained substantially higher than a year earlier.
Non-food prices remain major source of pressure
The 8.16 percent year-on-year increase in non-food prices was higher than the 5.66 percent increase recorded for food. This means that households are facing price pressures not only from essential food items but also from goods and services outside the food category. The increase in non-food prices is particularly important for household budgets because these expenditures can include a wide range of goods and services required for everyday living.
Food inflation, meanwhile, remains a significant concern. Food prices increased by 1.16 percent between June and July, contributing to the overall monthly rise in the CPI.
Inflation varies across regions
The Central Region recorded the highest year-on-year inflation at 6.41 percent, followed by the Western Region at 5.80 percent and the Capital City at 5.66 percent, while the Eastern Region recorded the lowest inflation rate at 5.32 percent.
The difference between the highest and lowest regional inflation rates was more than one percentage point, indicating that consumers across the country did not experience exactly the same degree of price pressure.
Although regional inflation remained below the national year-on-year rate of 6.83 percent in the figures presented by the NSB, the data highlights differences in the movement of consumer prices across geographical areas.
Monthly inflation shows mixed movement
The July figures also present a different picture when compared with the previous month. The national CPI rose by just 0.24 percent month-on-month, suggesting a relatively limited overall increase in prices during July.
However, the food component recorded a considerably stronger monthly increase of 1.16 percent. This was offset to some extent by a 0.69 percent decline in non-food prices. The monthly movement therefore shows that food was the main source of fresh inflationary pressure during July, even as non-food prices declined from their June levels.
Pressure on household purchasing power
The latest inflation figures come at a time when the cost of living remains an important economic concern for households and policymakers. An annual inflation rate of 6.83 percent means that, on average, the basket of goods and services measured by the CPI cost significantly more in July 2026 than it did in the same month last year.
For households whose incomes have not increased at a similar pace, sustained inflation can reduce real purchasing power. Rising prices can also influence consumption decisions, household savings and business costs.
For businesses, persistent increases in input and operating costs can affect pricing, investment and profitability. For policymakers, managing inflation while supporting economic growth remains an important balancing act.
Food and non-food trends require attention
While food inflation stood at 5.66 percent year-on-year, the non-food category recorded an even higher increase of 8.16 percent. At the same time, the month-on-month movements moved in opposite directions, with food prices rising and non-food prices falling. This divergence suggests that inflationary pressures are changing across different segments of the economy rather than moving uniformly.
Overall, Bhutan entered August with annual inflation at 6.83 percent, with the Central Region recording the highest regional inflation and the Eastern Region the lowest.
Tashi Namgyal, Thimphu