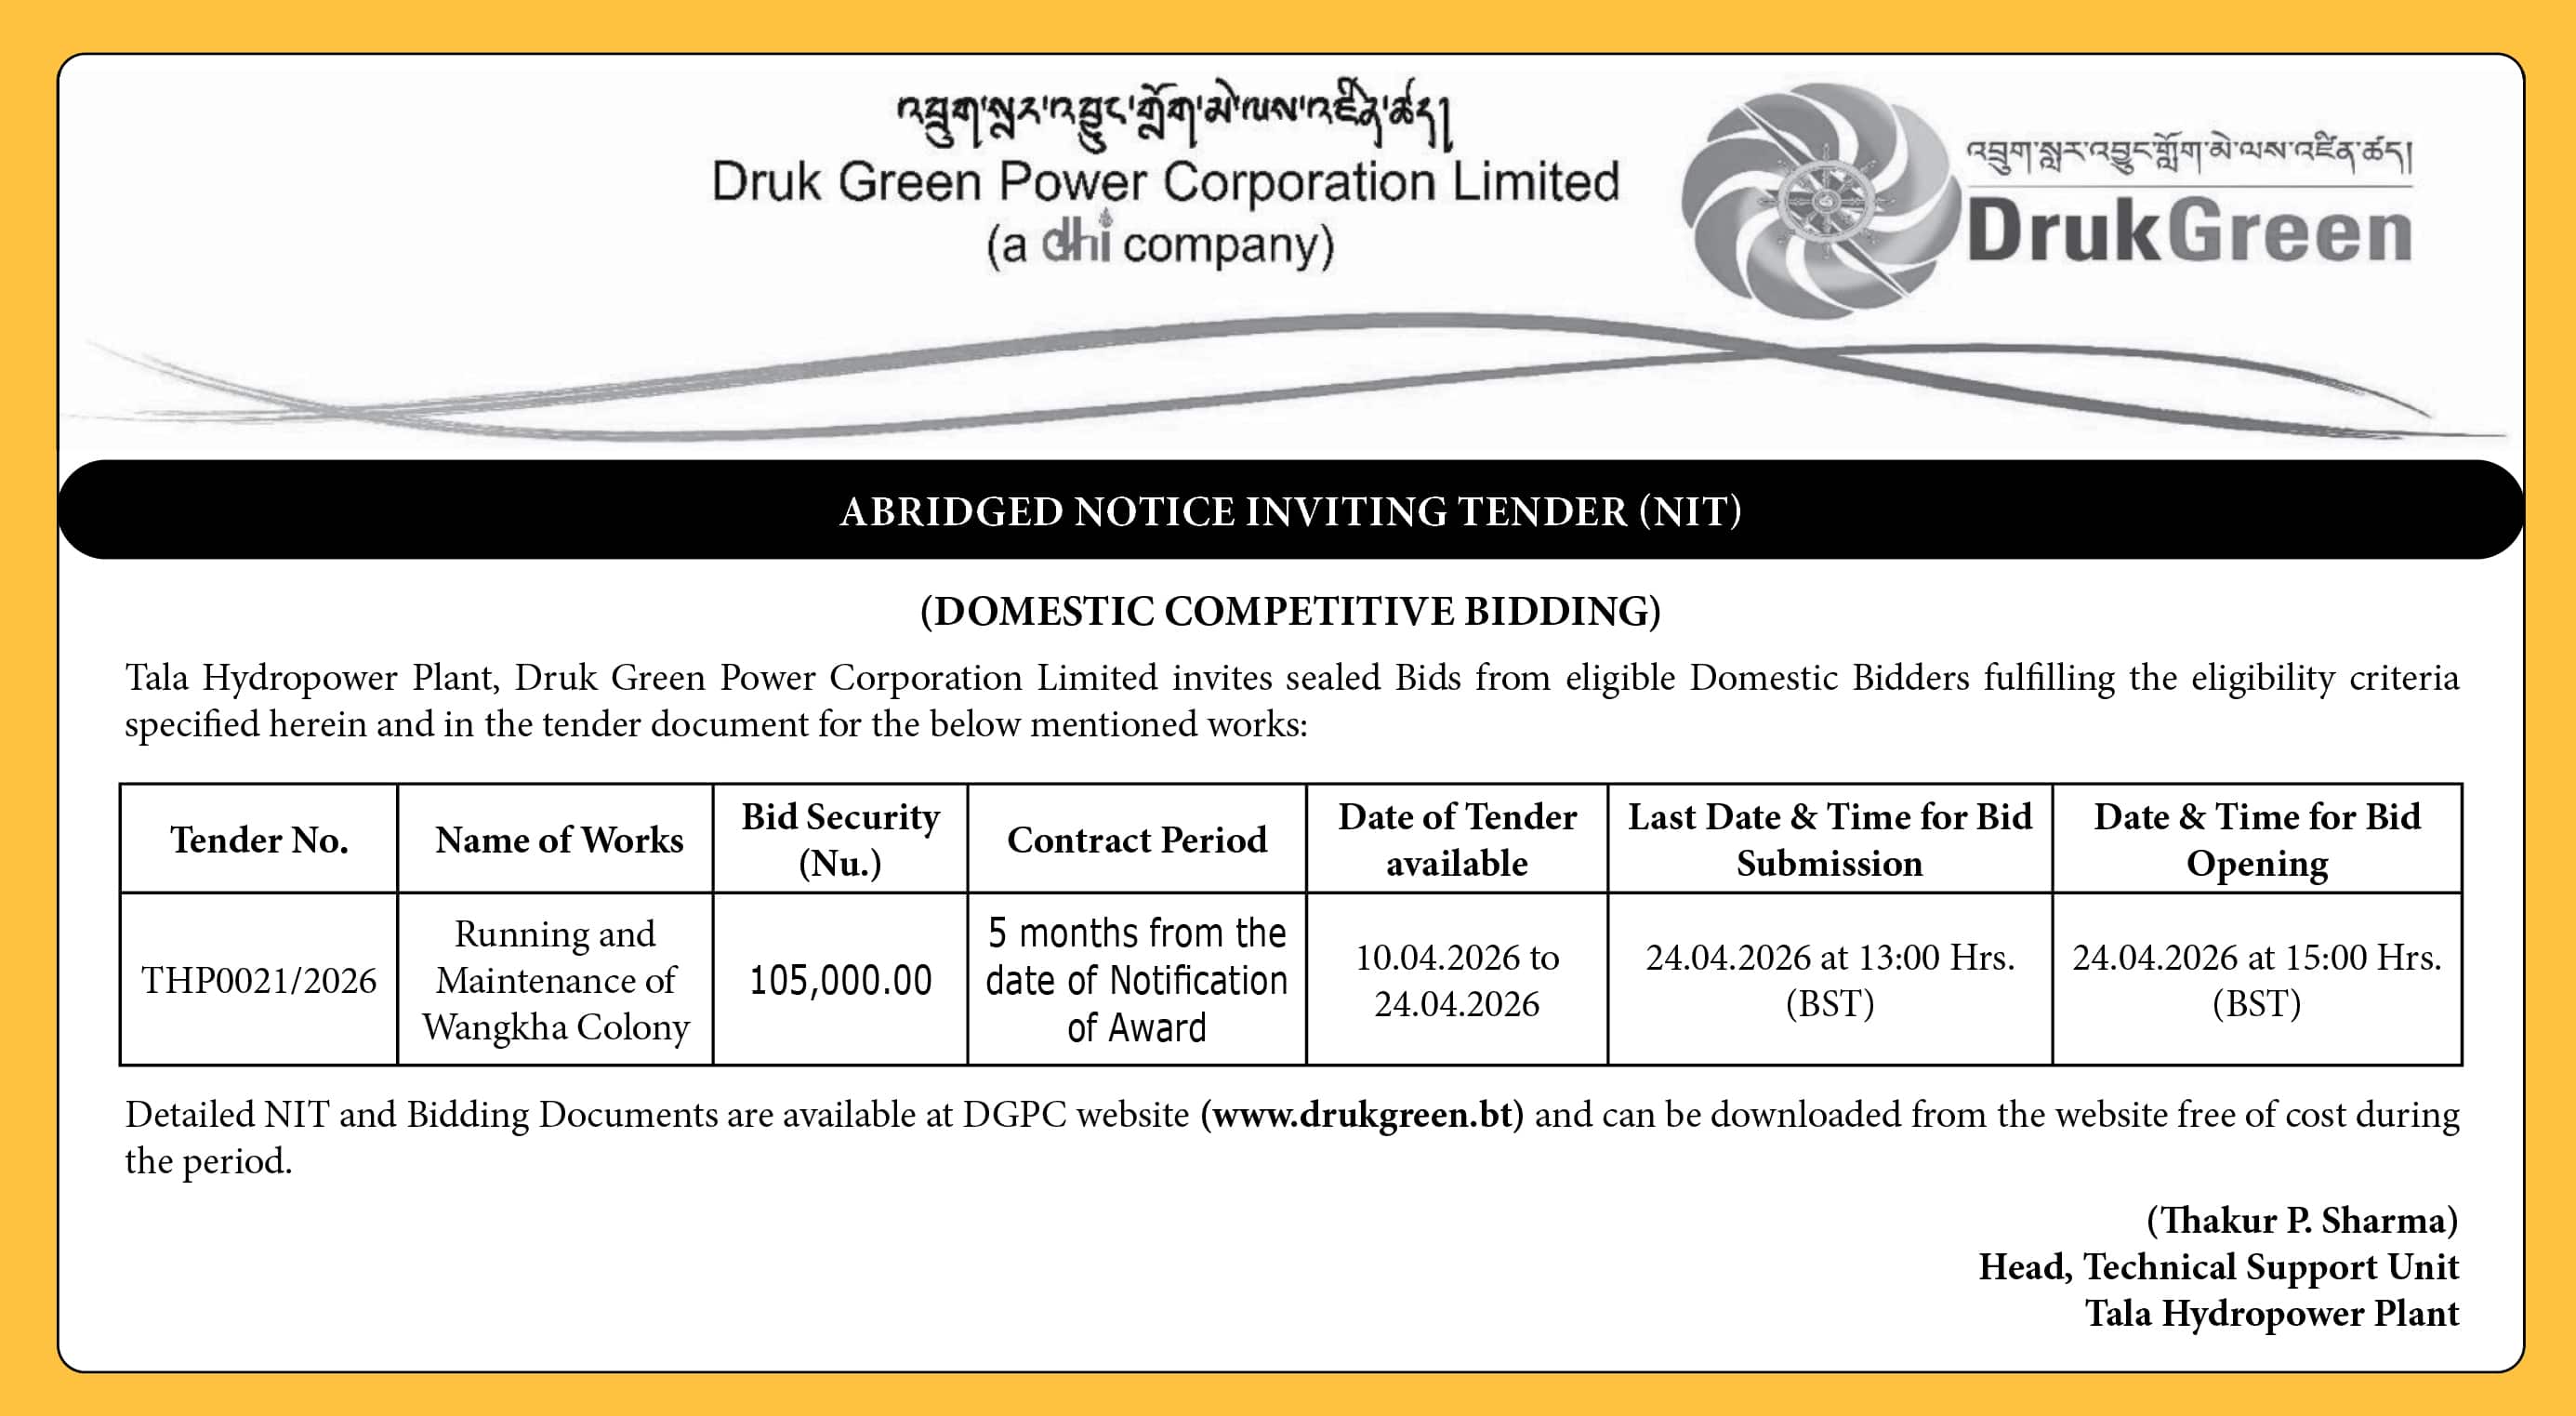
Food and Housing Costs Drive Price Pressures
The country’s headline inflation climbed to 6.07 percent in March 2026, reflecting broad-based price increases across both food and non-food categories, according to the latest Consumer Price Index (CPI) data. The uptick underscores persistent cost pressures in the economy, with rising food prices, housing costs, and service charges continuing to strain household budgets across the country.
Food inflation rose to 7.07 percent year-on-year in March, remaining a key driver of overall inflation. Within this category, prices for food and non-alcoholic beverages increased by 5.63 percent, while the alcoholic beverages and betel nuts segment surged sharply by 26.48%.
On a month-on-month basis, food inflation increased by 0.35 percent, driven by incremental price rises in essential food items and related products.
Non-food inflation rose to 6.51 percent year-on-year, indicating that price pressures are not limited to consumables alone. The increase was led by a sharp rise in housing and utilities, which recorded an 11.94% increase—one of the highest among all categories.
Other contributors include restaurants and hotels, which rose by 9.63 percent, and health services, which increased by 7.37 percent. Transport costs also recorded a moderate increase of 4.37 percent, reflecting rising fuel prices and mobility-related expenses.
Month-on-month, non-food inflation rose by 0.96 percent, largely driven by a significant increase in transport costs, which alone surged by 4.84 percent.
Inflation in Thimphu outpaced the national average, with year-on-year inflation reaching 6.63 percent in March. The increase was driven by a 6.99 percent rise in food prices and a 6.29 percent increase in non-food items.
Within the capital, restaurant and hotel prices recorded a notable 13.91% increase, followed by miscellaneous goods and services at 12.50% and housing and utilities at 9.97 percent. Transport costs in the city rose by 2.21 percent.
On a monthly basis, Thimphu recorded a sharper inflation increase of 1.35 percent. Food inflation rose by 1.56 percent, although the alcoholic beverages and betel nuts category saw a slight decline of 0.62 percent. Likewise, non-food inflation increased by 1.17 percent, primarily driven by a 5.39 percent jump in transport costs.
Inflation trends varied across regions, highlighting differences in consumption patterns and local market conditions.
The central region recorded the highest year-on-year inflation at 7.89 percent. Food inflation in the region rose to 6.85 percent, while non-food inflation reached 7.25 percent. Housing and utilities saw a sharp increase of 15.41%, alongside significant rises in clothing and footwear and restaurant services.
Month-on-month inflation in the central region stood at 0.53 percent, driven mainly by non-food price increases, particularly in transport.
In the eastern region, year-on-year inflation was comparatively lower at 4.14 percent. Food inflation stood at 5.03 percent, while non-food inflation was recorded at 3.11 percent. Health services, restaurants, and housing were the main contributors to the rise in prices.
Monthly inflation in the east rose by 0.80 percent, with transport costs again emerging as a key driver.
The western region recorded year-on-year inflation of 7.22 percent, with food prices increasing by 7.52 percent. A striking feature in this region was the sharp 35.20% rise in the alcoholic beverages and betel nuts index. Non-food inflation stood at 6.90 percent, led by housing, health, and restaurant costs.
Driven largely by transport-related price increases, month-on-month inflation in the west increased by 0.64 percent.
Beyond monthly fluctuations, longer-term data points to a steady rise in inflation. The annual average inflation rate increased to 3.50 percent in 2025, up from 2.82 percent in 2024.
Food inflation averaged 9.39 percent in 2025, driven largely by higher prices for food and non-alcoholic beverages. Non-food inflation also increased to 2.53 percent, with clothing, household goods, and services contributing to the rise.
However, some relief was observed in communication and transport costs, which recorded slight declines during the year.
The continued rise in prices has significantly affected the purchasing power of households. As of March 2026, the purchasing power of the Ngultrum stood at Nu 51.3 compared to its value in December 2012.
This means that Nu 100 today can buy goods and services worth only about half of what it could in 2012. Over the past year alone, purchasing power has declined by 5.72 percent.
Tashi Namgyal, Thimphu